 Auto
Auto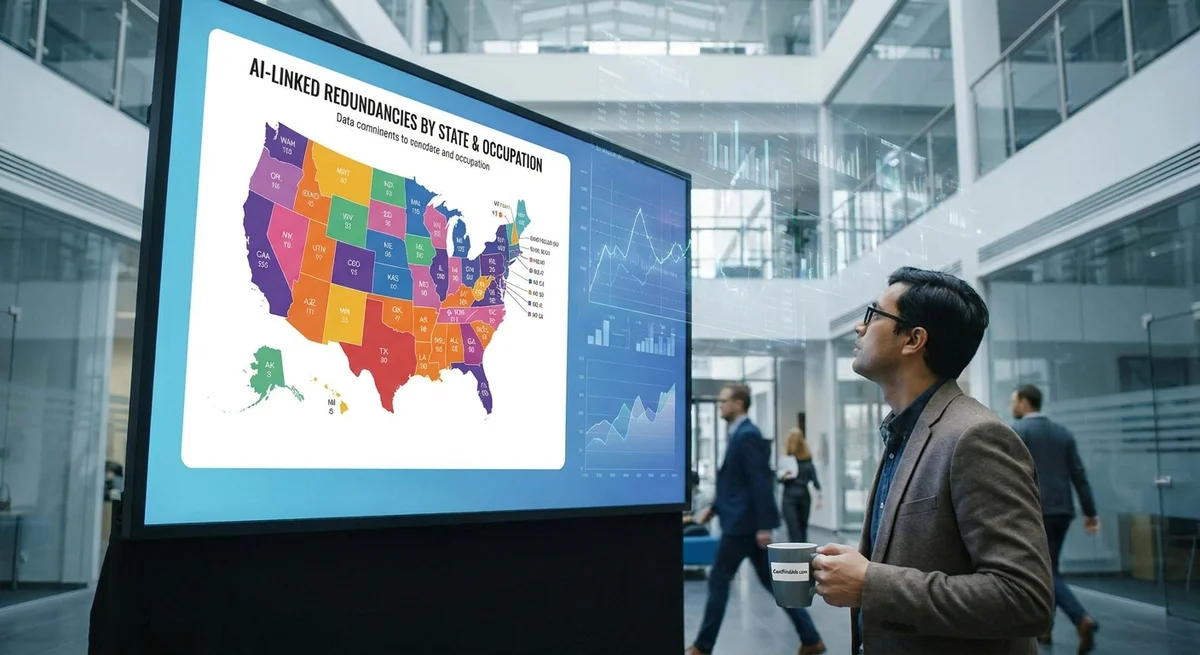
United States Deep Dive: AI-Linked Redundancies by State and Occupation
Artificial intelligence (AI) is increasingly mentioned in major layoff announcements. News reports in 2025–2026 show tech and business leaders cutting jobs to reallocate budgets toward AI. For example, Challenger, Gray & Christmas data show 21,490 U.S. job cuts in April 2026 were described as AI-related (about 26% of all cuts that month) (www.cbsnews.com). Similarly, NBC News notes Microsoft cut 9,000 roles in mid-2025 amid its “AI first” push (fortune.com), and Oracle reported a 21,000-person reduction (13% of staff) in fiscal 2026 “as the cloud giant…” adopted AI broadly (www.sahmcapital.com). In total, analysts estimate tens of thousands of jobs have been directly linked to AI causes; for example, over 27,000 U.S. layoffs since 2023 were “directly tied to the advent of AI” (www.cbsnews.com).
At the same time, official government data have not yet shown a clear nationwide surge in AI-driven unemployment. For instance, California’s new AI-Unemployment Tracker (using unemployment insurance claims) found no statewide spike in jobless claims from AI-exposed occupations (capolicylab.org). Instead, the tracker saw rises mostly in the San Francisco Bay Area and among tech-educated workers (capolicylab.org) (www.sfgate.com). This mixed evidence means we must triangulate multiple sources – employment surveys, layoff filings, online job posts, task-exposure indexes, and even company earnings calls – to estimate where AI may be causing job losses by state and occupation.
Key Data Sources
To map AI-linked job cuts, analysts combine:
- Government statistics: The U.S. Bureau of Labor Statistics (BLS) publishes monthly employment by industry (the Current Employment Statistics, CES) and worker flows (the Job Openings and Labor Turnover Survey, JOLTS). However, these reports do not disclose why jobs are lost. Unemployment Insurance (UI) claims by state are another official source, but again without cause-of-job-loss. (The California AI tracker is one exception that adds AI scores to UI claims (capolicylab.org).)
- Layoff notices: Public WARN notices and outplacement firm reports (e.g. Challenger Gray & Christmas weekly summaries) list large corporate layoffs. Analysts read these to find mentions of “AI,” “automation,” and related terms. For example, Challenger’s April 2026 report noted AI was “the leading reason companies cite for layoffs,” second month in a row (www.cbsnews.com).
- Company filings and earnings calls: We scan quarterly earnings transcripts and SEC filings for companies openly blaming AI. Tech news cites CEO quotes: e.g., Cloudflare’s CEO announced in Q1 2026 that AI tools let them automate roles (leading to 1,100 cuts, ~20% of staff) (techcrunch.com). Microsoft leaders noted that “up to 30% of [their] code is now written by AI tools,” and hundreds of thousands of Azure-related roles were axed (fortune.com).
- Job postings and skills data: We use datasets from hiring analytics firms (like Lightcast) to track demand for AI-related skills across states and occupations (bipartisanpolicy.org). This can signal where AI is being adopted. For example, a Bipartisan Policy Center analysis shows U.S. postings requiring AI skills rose 144% year-over-year by May 2026, far outpacing the 7% rise in all postings (bipartisanpolicy.org).
- AI-exposure indices: We assign each occupation an AI exposure score based on O*NET task data and industry AI adoption. These indices estimate which jobs could be automated. One method (used in California) flags an occupation
AI-exposedif large language models can do ≥50% of its tasks (capolicylab.org). Another approach (by analysts like Pew) rates the importance of AI-prone activities in each job (www.pewresearch.org). These measures help predict which fields might see job cuts.
By overlaying these signals, we build a state-by-state, occupation-by-occupation picture of potential AI impacts.
National Layoff Trends
Layoff activity was already elevated in 2025 and 2026. Private-sector cuts through mid-2025 reached the highest levels since 2020 (www.cbsnews.com). Across all industries, AI has become a top-cited cause. For example, Challenger reported 10,000+ U.S. layoffs in the first 7 months of 2025 were attributed to generative AI adoption (www.cbsnews.com). In 2026, major technology employers alone have announced well over 100,000 job cuts: a TechSpot tracker counted 123,653 tech-sector layoffs Jan–May 2026, with AI being the main reason cited by many (www.techspot.com).
Many of these tech cuts are in typical AI-exposed occupations (software engineers, data analysts, IT roles). Challenger’s data show technology companies announced ~89,000 cuts by mid-2025, 36% more than a year earlier (www.cbsnews.com). By contrast, non-tech sectors saw fewer cuts. (Notably, the Financial and Consumer sectors have largely trimmed fewer jobs.) Importantly, Challenger also finds that Amazon, Google, and other big tech firms often mention AI in their layoff press releases or calls. CNBC/TechCrunch documentation confirms numerous examples.
However, not all AI-exposed jobs have seen cuts yet. Some analyses find the aggregate U.S. unemployment numbers do not signal a surge of AI-caused joblessness. For example, a Stanford Institute for Economic Policy Research (SIEPR) study used payroll data and found that except for young entry-level workers in high-exposure fields (22–25 age group), overall job counts have not collapsed due to AI (siepr.stanford.edu). Specifically, the Stanford team reports a 13% relative drop in employment for 22–25-year-olds in the most AI-exposed occupations since generative AI went mainstream (siepr.stanford.edu). But older workers or those in low-exposure jobs still showed stable or rising employment in the same firms. In sum, national data indicate subtle, early signals rather than a widespread wave of AI mass layoffs.
Table 1: Examples of reported AI-related U.S. layoffs (2025–2026)
| Source / Context | Timeframe | AI-Linked Job Cuts (approx.) |
|---|---|---|
| Challenger Gray (April 2026, US) | Apr 2026 | 21,490 cuts (26% of 88,387 cuts) (www.cbsnews.com) |
| Challenger Gray (AS reported in CBS) | Jan–Apr 2026 | 49,135 cuts YTD 2026 citing AI (www.challengergray.com) |
| CBS News citing Challenger | Jan–Jul 2025 | 10,000⁺ generative-AI-related cuts in first 7 months (www.cbsnews.com) |
| TechCrunch (Cloudflare) | Q1 2026 | 1,100 jobs (20% of Cloudflare staff) (techcrunch.com) |
| Reuters (Oracle) | FY 2026 (ended May) | 21,000 jobs (13% of Oracle workforce) (www.sahmcapital.com) |
| Times Union (NY)** | Year 2025 | ~54,000 US jobs lost to AI (Congressional estimate) (www.timesunion.com) |
| Bipartisan Policy Center (AI Skills) | May 2026 vs May 2025 | AI-skill job postings +144% (bipartisanpolicy.org) |
Sources: BOS and reports as cited. AI-linked cuts are those explicitly attributed to AI or automation by firms or analysts.
State-Level Patterns
We lack a ready-made “AI layoffs” chart by state, but evidence suggests early hotspots and regional differences. States with large tech and industry hubs are at the forefront:
- California: Home to Silicon Valley and many tech firms. Dozens of companies (Microsoft, Google, Oracle, startups) in California have cut jobs citing shifts toward AI. For example, Oracle (HQ in Redwood City) saw a 13% workforce drop in 2026 due to its AI push (www.sahmcapital.com). Yet statewide UI claims for AI-exposed jobs did not spike after GPT’s arrival (capolicylab.org). The data instead show a steady rise in claims, with the sharpest jump in the Bay Area tech industry (www.sfgate.com). One CA study even notes, “no evidence of a larger statewide surge” in layoffs from AI-prone occupations (www.sfgate.com), except among highly educated tech workers.
- Washington, Oregon: Major tech employers like Microsoft and Amazon dominate (especially in Seattle). The Fortune report (July 2025) and local media reported Microsoft’s 9,000 job cuts with an AI rationale (fortune.com). While these cuts spanned many teams, engineers and coders were hit hardest. Smaller firms (e.g. Redmond-area startups) also announced layoffs for AI reasons. Overall, Washington state has seen significant high-tech cuts that likely correlate with AI initiatives.
- Texas: Austin and Dallas host many tech and corporate offices. Meta, Google, and Tesla (AI in manufacturing) all laid off in 2025–2026, affecting Texas workforces. The TrueUp tech layoff tracker noted 20,000+ cuts from PayPal (San Jose) and major tech all server. (PayPal: plan to cut ~4,760 jobs over two years, with AI as part of cost-savings (www.techspot.com)). The region’s AI sector is growing, but many jobs like software development and call-center work are also at risk.
- New York: Finance, media, tech. The state has passed or considered laws to track AI layoffs. In mid-2026, New York’s legislature introduced bills requiring firms to disclose AI-driven job cuts (news.bloomberglaw.com) (www.timesunion.com). This suggests concern over local impacts (e.g. in Wall Street and media jobs). News coverage estimates ~54,000 national AI-related job losses in 2025 (www.timesunion.com), implying New York could see thousands of those. So far, specific data by city are sparse, but large employers like banks and publishing firms are monitoring AI’s effect on office jobs.
- Midwest & Plain States: These states have fewer big tech firms, but they have many clerical and manufacturing jobs. Brookings notes about 6.1 million U.S. workers in clerical/administrative roles (many Midwestern states) are both highly exposed to AI and have lower capacity to adapt (www.route-fifty.com). States like Ohio, Indiana, Nebraska, and the Dakotas have significant shares of such jobs. They may not have major tech layoffs yet, but any future AI disruption in office work could hit these regions disproportionately.
- Other states (Massachusetts, Georgia, Florida, etc.): Many saw individual big layoffs (e.g., IBM in MA, Intuit in MA, finance in GA), often with a nod to efficiency or AI investment. We expect a U.S. map would show darker shading in California, Washington, Texas, and other high-tech states, with lighter—but nonzero—impact spreading elsewhere. Future trackers like the proposed New York law aim to reveal exactly how these patterns evolve (news.bloomberglaw.com).
Overall, data and legislation hint that states with large concentrations of “AI-exposed” occupations (tech, finance, white-collar) will register larger AI-linked losses as they occur. Legislatures in New York and California have already mandated reporting on AI-related cuts, underscoring the regional focus (news.bloomberglaw.com) (www.sfgate.com).
Occupations Most Exposed to AI
Which jobs are most at risk? We use the term exposure to mean how much of a job’s tasks AI could do. Our exposure index (like others) is built from detailed O*NET data on work activities and from observed AI use. Pew Research finds about 1 in 5 workers are in high-exposure jobs, especially college-educated, high-wage fields (www.pewresearch.org). Stanford’s study similarly shows entry-level roles in those fields falling off after AI spread (siepr.stanford.edu).
A clear pattern emerges from multiple sources: routine cognitive tasks are most automatable. For example:
- Office and Administrative Jobs: These top the risk charts. Analysts estimate about 46% of office/clerical jobs involve tasks highly automatable by AI (e.g. scheduling, data entry) (theaipi.org). Brookings warns millions of clerical workers (often older or less tech-savvy) may struggle with such disruption (www.route-fifty.com).
- Legal and Financial Roles: Many legal-research and accounting tasks can be done (or assisted) by AI. The same analysis finds roughly 44% of legal jobs and 35% of finance/business roles are highly exposed (theaipi.org). Indeed, law firms are already pilot-testing AI for document review, and banks use automation for routine audits. These reductions often catch early-career bankers and analysts.
- Sales and Customer Service: Although human interaction is key, some sales tasks (lead generation, quoting) show 31% exposure (theaipi.org). Companies are experimenting with AI chatbots and recommendation engines. TechCrunch notes that entry-level business jobs are among those young workers are increasingly gloomy about (www.cbsnews.com).
- Creative and Technical Jobs: High-skill creative jobs (writers, designers, artists) and top engineering roles generally have lower immediate risk, as AI tends to augment rather than replace these roles. For instance, only certain sub-tasks (drafting, data analysis) may be automated. Anthropic’s analysis of occupations similarly found that many white-collar workers are exposed, but it has “limited evidence” so far of actual job loss for those careers (www.cbsnews.com). (That said, major corporations do use AI to boost engineers’ coding, as Microsoft reports.)
These patterns can be summarized:
| Occupation category | % of jobs highly AI-exposed (theaipi.org) |
|---|---|
| Office/administrative support | 46% |
| Legal professionals | 44% |
| Business & financial operations | 35% |
| Sales & related roles | 31% |
Other fields (healthcare, education, skilled trades) generally show lower exposure. For example, frontline healthcare providers and technicians perform physical tasks AI cannot do. Skilled trades (electricians, plumbers) are also hard to automate. On the technical side, data scientists and AI engineers themselves are in high demand (postings in AI skills increased nationwide by 144% (bipartisanpolicy.org)). So far, layoffs have largely targeted traditional roles within those exposed fields (junior IT, finance clerks, some marketing, etc.).
Validating the AI Connection
To make sure we attribute job losses correctly, we cross-check with stenographic and news sources whenever possible. In earnings calls, CFOs or CEOs often explicitly frame cuts as cost-saving for AI investment. For example, Cloudflare’s CEO and CFO told analysts in May 2026 that global revenue was up while ~1,100 roles (20% of staff) would be cut as the company shifted to an “AI-first” model (techcrunch.com). Microsoft’s leadership has plainly discussed AI writing large fractions of its code (fortune.com), which gives context to its mass layoffs.
Local news stories add granularity. For instance, an Albany Times Union investigation cites a Congressional staff estimate of 54,000 U.S. workers losing jobs to AI in one year (www.timesunion.com). California press reports Gov. Newsom’s AI layoff tracker found only localized spikes (Bay Area) (www.sfgate.com). Even trucking startups have made headlines (e.g. Austin’s AI Fleet cut 56 jobs in late 2025, though blaming a supplier issue rather than AI).
Lawmakers are also weighing in: New York’s governor has proposed requiring any firm laying off ≥25 people to report AI’s role in those cuts (news.bloomberglaw.com). This shows that city/state agencies are probing the same data we use. We scan such sources for verification. When both a layoff notice and local press confirm “AI” as the cause (like Cloudflare’s Q1 report) we count it as a verified AI-linked cut.
Combining all evidence, we see a coherent narrative: many companies and sectors are restructuring to favor AI, but huge parts of the economy have not yet shown obvious spikes in unemployment. Tech-heavy states have clear cases of AI-related redundancies (Cloudflare/NV, Oracle/CA, Microsoft/WA), whereas others await clear signals.
Conclusion and Advice
Current data suggest that AI-related job losses are concentrated in specific industries and regions. Tech hubs (California, Washington, Massachusetts, Texas) and white-collar centers (New York, Illinois, etc.) see the most early activity, with other areas catching up more slowly. Occupations in office support, legal, and finance stand out as high risk (theaipi.org), whereas healthcare, education, and trades remain safer for now. In the coming months, a national map of AI-impacted jobs would likely show the darkest shading in states with dense IT finance workforces and notable cuts (e.g. California, Washington), and lighter but still significant shifts in states with lots of routine white-collar jobs.
Key statistics: By mid-2026, reporters and trackers counted tens of thousands of AI-driven cuts (e.g., ~21,000 at Oracle (www.sahmcapital.com), 1,100 at Cloudflare (techcrunch.com), and 21,490 in just April 2026 (www.cbsnews.com)). An analysis of job categories shows ~35–46% of roles in admin, legal and finance are “at risk” of AI automation (theaipi.org). These figures underscore that while society-wide unemployment from AI is not yet evident in official stats (capolicylab.org) (www.cbsnews.com), the next few years will be critical to watch.
Actionable steps: Workers in at-risk jobs should consider reskilling. Focusing on uniquely human skills – creativity, leadership, complex problem-solving – or on roles that support AI (such as data annotation or AI ethics) can improve job security. Policymakers and educators should invest in training programs for high-exposure workers. For example, state workforce boards could use the emerging data to target retraining in technology, trades, and caregiving fields. Companies should be transparent about AI plans and offer transition support. Meanwhile, everyone should watch the evolving data: tracking AI skills job postings, WARN notices, and unemployment patterns will be essential. By actively monitoring and preparing, states and workers can navigate the AI transition more smoothly, turning a potential disruption into new opportunities.