 Auto
Auto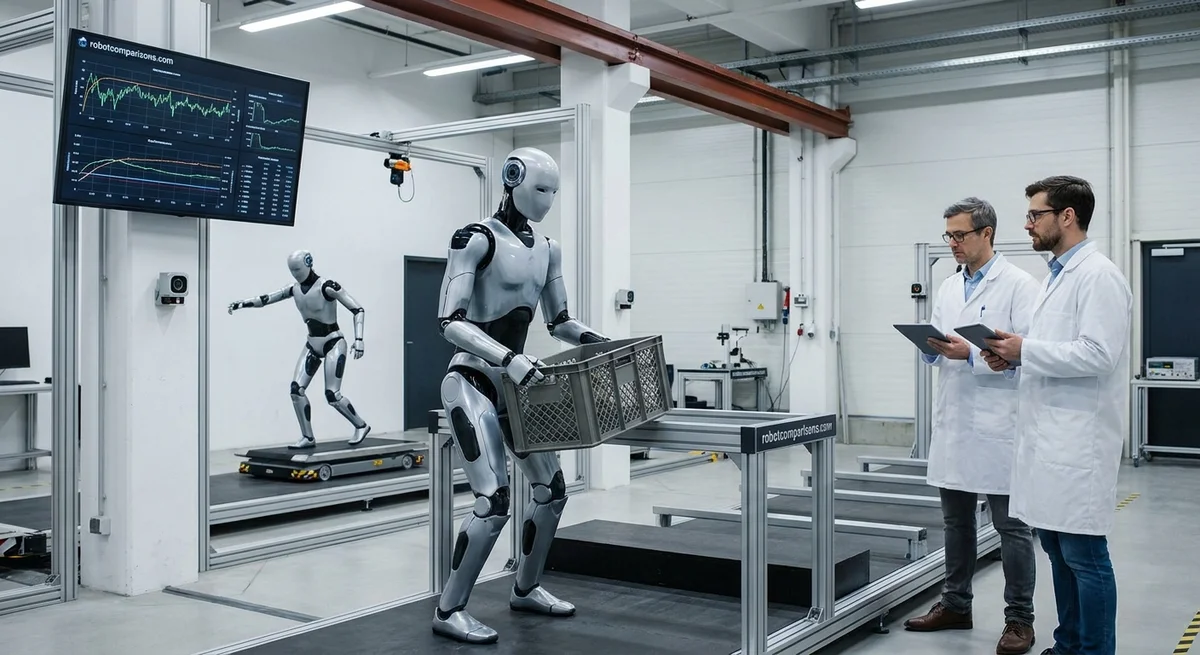
Introduction
Humanoid robots – machines that look and move like people – are becoming real products in 2026. Big companies (Tesla, BMW, BYD, etc.) are working hard on humanoid robots. But flashy videos alone are not enough. We need clear tests to see how well these robots really work. In fact, experts say we need new, objective tests because the last big robot contest (the DARPA Robotics Challenge) was in 2013–2014 (www.nist.gov). German researchers at Fraunhofer IPA agree: they warn that media demos can be misleading, so manufacturers and users need standardized benchmarks behind the scenes (www.ipa.fraunhofer.de). They even broke the tests into six categories (basic skills, advanced skills, cleanroom use, safety, cybersecurity, energy) so nothing is missed (interaktiv.ipa.fraunhofer.de). In this article we describe a vendor-agnostic test suite for 2026, with clear protocols for walking, handling objects, sensing, and self-driven tasks. We include example KPIs (scores) and dashboard layouts.
Locomotion Tests (Walking and Balance)
A key part of being humanoid is locomotion – how the robot walks and moves. Tests should check:
- Flat-ground speed: Measure how fast the robot can walk or run on level floor. For example, time it over 10 meters and compute meters/second. Record any missteps.
- Stairs and steps: Give the robot a standard staircase to climb up and down. Count how many steps it can do in a row without falling. Measure its speed up the stairs. Older studies even did drills with robots climbing a 10–15 cm step, showing that new control methods can work but need testing (www.frontiersin.org). For benchmarking, require the robot to climb a set number of steps within a time limit.
- Slopes and ramps: Place the robot on an incline (for example 3° to 5° slopes) to go up and down (www.frontiersin.org). Measure energy use or speed. Studies show robots use more energy on uphill slopes than on flat ground (www.frontiersin.org). A pass could be, for example, completing a 5° slope climb without losing balance.
- Payload walking: Test the robot carrying extra weight (like 5 or 10 kg) on its back or arms. Have it walk a fixed course. Measure if speed drops or balance changes. For example, walk 20 meters with a 10 kg load; record if it falls or how much slower it gets.
- Drifting and balance: Optionally include a small push or tilt to see if the robot can recover balance. This tests robustness, but the main goal is repeatable tasks.
For all locomotion tests, clear instrumentation is needed: use stopwatches or motion trackers to measure time, floor markings, step counters, and rugged surfaces to simulate real conditions. Record distance covered, time taken, and number of stumbles or falls. Use camera or motion-capture (IR markers) for precise speed and posture logging if available.
Manipulation Tests (Dexterity and Strength)
Humanoid robots often have arms and hands to manipulate objects. We should test how well they can pick up, carry, and place items. Example tests:
- Pick-and-place tasks: Give the robot a set of common objects (blocks, boxes, bottles) and have it move them from one bin to another. For instance, place 10 plastic bottles in a tray; ask the robot to put each bottle on a shelf. Count how many it succeeds without dropping or knocking over. Measure the placement accuracy (how close to the target). Repeat for repeated trials. Research on robot benchmarks suggests using simple scenes (like picking fruits or blocks) and measuring success rate (elib.dlr.de). For example, a published framework uses fruit in bins to objectively compare pick-place performance (elib.dlr.de).
- Fine manipulation: Use small objects (like bolts, small tools, or an egg). Test if the robot can pick up a small piece and insert it into a hole or carry an egg without breaking it. Example: place a small steel ball in a cup on a table; ask the robot to deposit it in a small hole. If it drops or misses the hole, that’s a failure.
- Strength tests: Attach a heavy object (like a weighted bucket) for the robot to carry a certain distance, or lift and hold. For example, fill a bucket with 5 kg of sand. Tell the robot to carry it 5 meters without dropping. This tests load capacity.
- Task completion time: Measure how long each pick-and-place or assembly task takes. Faster times are better if accuracy is still met.
Instrumentation for manipulation: use marks on tables or scales to measure force. Track object positions with vision or motion sensors. Log the number of successful grasps vs attempts. Data can be recorded as time-stamped events (e.g. “time, object ID, success/fail”).
Perception Tests (Vision and Sensing)
To work on its own, a humanoid robot needs good sensors (like cameras, lidar). We test its perception with simple challenges:
- Object recognition: Place objects of various shapes and colors in view. Test if the robot can count them or pick out a specific one on command. For example, tell the robot “find the red ball” among other balls. Check if it correctly locates it. Success rate and time are metrics.
- Distance sensing and navigation: Set up a small obstacle course with cones or boxes. The robot must walk around obstacles to reach a goal. Success is no collisions. Measure path taken (should be reasonably direct) and time to finish.
- Sensor calibration: Tests for drift or noise: e.g., have the robot identify the same object under different lighting or after some time, to see if sensor errors accumulate.
Equipment: use known markers or QR codes as references. Logging: robot’s self-reported sensor readings can be logged in files. Timing and accuracy can be stored in CSV or JSON lines format (real.mtak.hu) (for example, one study compared JSON vs native ROS logging for robot data (real.mtak.hu)).
Autonomy Tests (Task Completion and Intelligence)
We also evaluate how well the robot plans and executes multi-step tasks on its own. In these tests, the robot must use a combination of mobility, manipulation and perception:
- Multi-step scenarios: Give the robot a list of tasks, like “pick up object A, put it on table B, then push cart from here to there.” The robot should perform the steps in order without human help. Metrics: Was the task completed? Did it take the most likely route?
- Decision-making: Pose a choice, e.g. “You see two objects; drink from cup, throw ball in bin.” Check if it understands the commands and acts correctly.
- Environment change: During a long task, slightly change the environment (move an obstacle). See if the robot adapts.
These mimic real tasks (like assembly or fetch). Success criteria are clear: the task must be fully completed and safe. Measure total time and errors. For example, if a robot is told to set a table, did it place all plates and forks correctly?
Modern humanoids use AI for autonomy. For example, Tesla’s Optimus robot is built on the same self-driving AI software used in Tesla cars (www.techradar.com). That means tasks like moving around or picking objects rely on learned models. Our benchmarks should account for that: record if the robot needed many retries (learning issues) or if the AI failed (e.g., mis-identified an object).
Instrumentation and Data Logging
To make tests reproducible, we need the right tools and data formats:
-
Sensors & Tools: Use motion-tracking cameras or floor markers to measure positions. Use stopwatches or timers to track duration. Connect power meters or use built-in monitors to record battery current. Employ force/pressure sensors for foot pressure or gripper grip strength. If possible, use a motion-capture system (like markers on joints) to log the walk sequence.
-
Data Logging: Record all sensor data with timestamps. For simplicity, use common formats. For example, log entries in CSV or JSON lines ("one event per line"), with columns like time, battery level, x-position, y-position, joint angles, task status, etc. Many robots use the Robot Operating System (ROS) which can log to “bag” files, or export to text. Researchers have even benchmarked logging methods, comparing JSON to native ROS protocols (real.mtak.hu). The format is less important than consistency: everyone should label fields the same way (e.g. “severity of fall = 1 or 0”).
-
Dashboard Friendly: It helps if logs feed into simple dashboards. For example, save key metrics (speed, error counts, battery) in a spreadsheet-friendly form so they can be visualized.
Each test’s data file should include the robot ID, test name, date, and version in a header, so results can be compared easily. The test protocol (steps, setup) should be written down, and data saved for review later.
Pass/Fail Criteria and Fairness
To avoid bias, every test must have clear pass/fail rules and be repeatable:
- Fixed Conditions: Describe exactly the environment (stair height, slope degree, object positions) so every robot is tested the same way. If possible, automate the environment (e.g. a conveyor that delivers objects at fixed rate) instead of letting a person place items by hand.
- Thresholds: For each task define numeric thresholds. Example criteria: “Robot must climb 5 stair steps in under 15 seconds to pass.” Or “Pick-and-place success must be ≥90% in 10 tries.” If the robot falls or exceeds time, it fails that sub-test. Do multiple runs (say 3 trials) and take the average or best time.
- Demo Bias: To prevent companies from cherry-picking only easy demos, tests should be run by impartial engineers. Ideally, have an independent lab or a robot referee run the tests without vendor assistance. Keep video or sensor logs as evidence so no changes go unseen.
The goal is to minimize any “hand-holding.” For instance, if a robot has the best performance when human operators secretly help it balance, that should not count. Instead, robot should be in autonomous mode for the actual test.
KPIs and Monitoring Dashboards
After running tests, we want Key Performance Indicators (KPIs) to summarize results in charts or tables. These KPIs help engineers and managers compare robots at a glance. Here are example dashboard metrics for two cases:
-
Pilot Test Dashboard (One-time evaluation): In early trials, we care about raw performance vs targets. For example:
- Walking speed: measured in m/s (target ≥ 1.0).
- Stair success rate: how many tries out of 5 the robot climbed correctly (target ≥ 4/5).
- Pick-and-place accuracy: percent of items placed correctly (target ≥ 90%).
- Battery life on benchmark task: minutes until discharge (target ≥ 60 min).
- Safety incidents: count of falls or collisions (target = 0).
These can be shown in a table or bar chart. For example, a small table might list Robot A vs Robot B:
KPI Unit Target Robot A Robot B Walking speed m/s ≥ 1.0 0.8 1.2 Stair success /5 4 4/5 5/5 Pick-place accuracy % ≥ 90 85 92 Battery life (fixed task) min ≥ 60 50 72 Task completion % ≥ 95 90 96 In human-friendly terms: “Robot B passed all targets; Robot A is slower and needs work on handling items.” Charts can highlight which metrics are below target (e.g. red bars for misses).
-
Production Monitoring Dashboard (Ongoing): For deployed robots in a factory or service, tracking day-to-day health is key. Useful KPIs include:
- Uptime (%): Fraction of scheduled time the robot is active and not down for faults. (Target > 95%).
- Tasks completed/day: How many jobs (e.g. items moved) per day. This shows productivity.
- Error rate (%): Fraction of tasks that fail or need human fix. (Target < 5%).
- Battery cycles: How many full charge cycles per week (too high means heavy use or inefficiency).
- Mean repair time: Time to fix issues (lower is better).
For example, a sample weekly summary might show: “Uptime 97%, 500 tasks completed, 2% error rate,” which is good. If a robot’s error rate jumps one week, maintenance teams get alerted.
Each KPI can be plotted over time (daily or weekly) in the dashboard. This ongoing monitoring helps spot trends. For instance, if walking speed slowly drops, or battery life diminishes after 6 months, those are early warnings of wear.
Conclusion
By 2026, humanoid robots are moving out of labs, and we need clear tests to know what they can really do. A vendor-agnostic benchmark suite ensures we compare apples to apples. We propose standardized tasks for walking (stairs, slopes, etc.), object handling (pick-and-place, payload carrying), and cognitive ability (multi-step tasks with AI). Instrumentation like motion trackers, cameras, scales, and power meters will record each run. Data should be logged in simple formats (CSV/JSON) so anyone can analyze it.
Pass/fail criteria (speed thresholds, success rates) make the tests fair and repeatable, cutting down on “demos” that look good but aren’t reliable. Defined KPIs and dashboards then let engineers and business leaders see a robot’s strengths and weaknesses at a glance, and track improvements over time. For example, a pilot dashboard might show walking speed = 0.8 m/s and pick accuracy = 85%, signaling “almost there” if targets were 1.0 m/s and 90% accuracy. In production, charts of uptime and tasks-per-day keep teams on top of any drifts.
This honest, methodical approach helps buyers and developers alike. Customers get real data on what the robot can do, and makers get clear goals to improve. As Fraunhofer IPA notes, these benchmarks bring transparency to an “opaque” market (www.ipa.fraunhofer.de). With consistent testing and clear KPIs, we can make sure the next generation of humanoids is as capable as their creators promise.