 Auto
Auto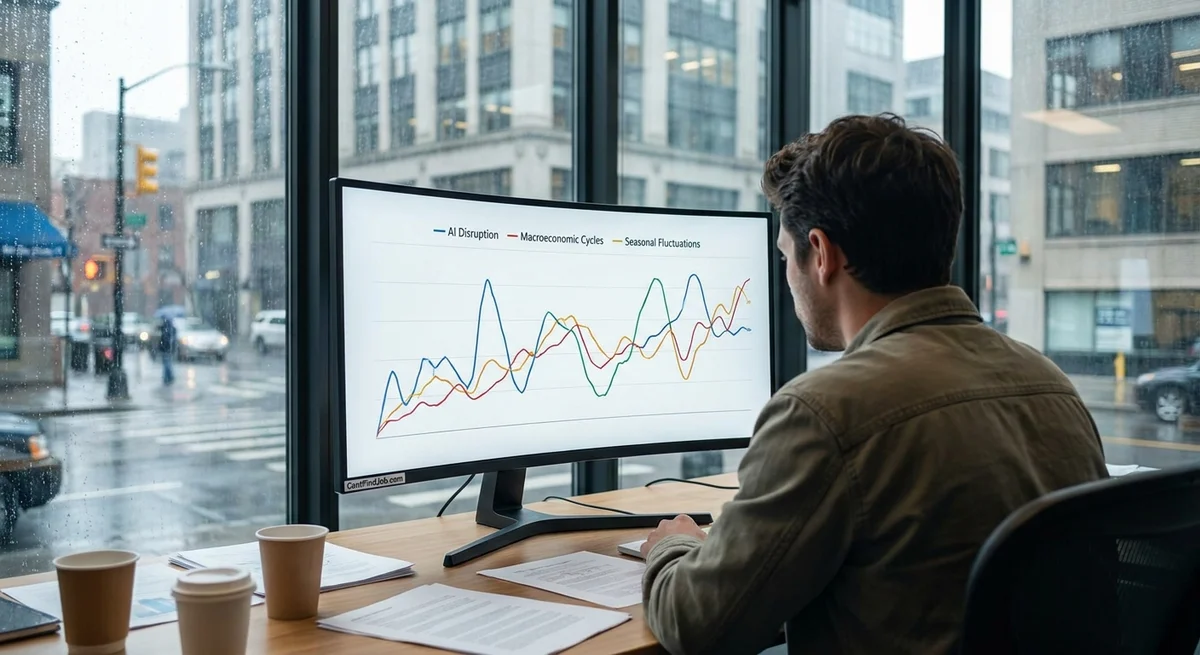
Introduction
In March 2026, dozens of companies announced large layoffs. To understand why jobs were lost, analysts must separate the effects of artificial intelligence (AI) from ordinary economic cycles, seasonal patterns, and policy changes. For example, a Los Angeles Times report found that tech firms cited AI in over 48,000 U.S. job cuts in 2025 (www.latimes.com), but observers warn that some companies may be using “AI” as an excuse while real causes include overexpansion or weak demand (www.latimes.com) (www.hrdive.com). Attribution science asks: were March 2026 layoffs primarily due to new AI tools, a drop in customer demand, normal seasonal turnover, or new regulations?
This article outlines a clear, step-by-step method to estimate the share of layoffs caused by AI versus other factors. First, we collect all layoff announcements (press releases, SEC filings, etc.) and use text classification to label the stated reasons (AI-related vs. demand-related vs. seasonal or regulatory). Second, we apply time-series decomposition to total job-loss data to remove normal seasonal cycles. Third, we construct synthetic controls – weighted “twin” scenarios drawn from similar firms or regions – to estimate what layoffs would have been without a specific AI shock. Finally, we validate our results by checking related indicators, such as dates when companies adopted major AI software and rising automation investment. Throughout, we document each step and test alternative assumptions. This transparent, data-driven workflow helps ensure that conclusions (and any policy advice) rest on solid evidence rather than anecdotes.
Text Classification of Layoff Announcements
We first gather every public report of layoffs in March 2026 (e.g. official memos, press releases, stock filings). Using Natural Language Processing, we programmatically scan each text to detect key terms or themes. For instance, we count mentions of “AI” or “automation” vs. words like “demand,” “restructure,” or “seasonal.” This approach is similar to a recent analysis of tech layoff letters, where researchers split each memo into sentences and tagged keywords to identify themes (flowingdata.com). In practice, we might train a classifier (e.g. with machine learning models or keyword rules) on annotated examples so it learns patterns like “AI-driven efficiency” or “headcount reduction.”
Each announcement then gets a label (e.g. “AI-related”, “demand-adjustment”, “seasonal”, “regulatory cut”, etc.) based on its content. Sentences may be tagged with more than one category (e.g. a memo could mention both automation and market conditions). We verify the classification by manually checking a sample. The result is a count of layoffs that companies explicitly attributed to AI versus other stated reasons. This step is crucial because it gives a direct, text-based estimate of motives, but on its own it may over-count stated AI causes (some firms might highlight AI even if it was not the main reason).
Time-Series Decomposition of Job-Loss Data
Next, we analyze aggregate job-loss numbers with standard time-series methods. Total layoffs or unemployment claims follow long-term trends and seasonal cycles (for example, many industries lay off workers after holiday sales or fiscal-year ends). We use time-series decomposition to break the data into three parts: trend (T), seasonal (S), and remainder (R) (otexts.com). In simple terms, this means writing each month’s layoffs as
Layoffs = Trend + Seasonal + Irregular.
By estimating and subtracting the expected seasonal effect in March (based on historical patterns), we isolate the unusual intramonth change. For example, if March normally has 5% more layoffs due to year-end factors, we adjust for that. This step filters out the routine ups and downs so that any spike in March 2026 stands out from the baseline pattern.
We also adjust for broad demand shocks. For instance, if overall economic indicators (like GDP growth or retail sales) fell sharply in early 2026, those business-cycle effects would show up in the trend component. In practice, we might fit a model (such as classical decomposition or STL) and compare different methods to ensure robustness. By analyzing seasonally adjusted layoffs, we better see if March 2026 was truly exceptional or simply followed the usual cycle.
Synthetic Control Estimation
To quantify the causal effect of AI on layoffs, we use a synthetic control method. Synthetic control is a way to build a counterfactual – a “what would have happened otherwise” scenario – when a randomized experiment isn’t possible (pmc.ncbi.nlm.nih.gov). For our case, imagine treating March 2026 as an “intervention” (the impact of AI). We create a synthetic version of the labor market by taking a weighted mix of other sectors or prior months that were not exposed to the specific AI shock.
Concretely, one could define a “treated unit” (e.g. the set of firms known to deploy new AI tools in early 2026) and a donor pool of firms without such deployment. The synthetic control algorithm then chooses weights for the donor firms so that their pre-2026 layoffs closely match the treated group’s history. After March 2026, any difference between the treated group’s actual layoffs and the synthetic control’s predicted layoffs is attributed to the AI effect (pmc.ncbi.nlm.nih.gov). In other words, we ask: if the treated companies had not adopted the new AI technology this March, how many layoffs would we expect (based on the experience of similar firms)?
This powerful approach has been used in economics and public health to estimate policy impacts (e.g. a new law in one state) (pmc.ncbi.nlm.nih.gov). It relies on having enough comparable units and a stable pre-trend. In practice, we would try variations: treat an entire industry-wide AI shift as one unit, or treat each large tech company individually. We also check results using simpler difference-in-differences models (comparing treated vs. control time trends) as a robustness test.
Alternative Indicators and Validations
To validate any conclusion about AI, we cross-check with other data:
-
AI Adoption Timeline: We note key dates when AI tools went live. For example, ChatGPT’s public launch was Nov 30, 2022, and GPT-4 appeared by early 2023 (www.ciodive.com) (www.ciodive.com). We also track the roll-out times of company-specific AI initiatives (like Microsoft Copilot in mid-2023 (www.ciodive.com)). If layoffs suddenly jump only after these dates, it supports an AI link. Conversely, if cuts happened with no coincident AI rollout, that suggests other causes.
-
Automation/CAPEX Spending: Rapid growth in automation investment can hint at labor displacement. For instance, recent data show U.S. corporate spending on computers and software (likely for AI) rose dramatically, while investment in other equipment fell (fortune.com). A Pantheon report noted that without AI-related spending, total equipment investment would be negative (fortune.com). We can correlate firm-level or industry-level capex on AI hardware with their changes in employment. If firms plowing money into AI infrastructure then cut many jobs, that supports an AI effect.
-
Task-Exposure Indices: Economists have built “AI exposure” scores for occupations (based on routine tasks, see O*NET surveys). We can use these as covariates. Importantly, recent research finds individual exposure scores alone do not reliably predict actual unemployment or job-separation rates (axi.lims.ac.uk). That study shows different AI indices highlight different aspects, so only an ensemble (combined measure) had useful power (axi.lims.ac.uk). In our analysis, we might include a composite exposure index or interact it with whether a firm adopted AI. If high-exposure industries see disproportional cuts only after adopting AI, that again points to AI-driven layoffs.
By comparing the timing and magnitude of changes in these indicators, we judge whether our initial attribution seems plausible. For example, if text analysis flagged 1,000 jobs as “AI-related” but those companies only spent minimally on AI tools, that discrepancy would raise doubt (and vice versa). These checks make the inference stronger.
Workflow and Sensitivity Analysis
All steps above are coded in a transparent workflow. We’d use reproducible tools (e.g. Python or R scripts) and share datasets and code publicly. For example, layoff texts might be stored in a database and the classification model’s code documented. Time-series decomposition uses well-known libraries (such as statsmodels or forecast packages) with fixed parameters, so others can replicate the seasonal adjustment. Synthetic control can be implemented via packages like synth or tidysynth given our data.
We also perform sensitivity tests. This means re-running the analysis under different assumptions: using a stricter rule for flagging “AI” in text (to see if results hold when we only count very explicit mentions), excluding outlier companies, changing how we adjust for seasonality (additive vs. multiplicative), or using alternative donor pools for the synthetic control. If the share of layoffs attributed to AI stays roughly similar across these variations, our conclusion is robust. Any major swing would signal uncertainty and need for caution.
Throughout, careful documentation is key. Every dataset (layoff announcements, employment statistics, AI adoption dates, capital spending) is logged. Statistical code includes comments and version control. This transparency ensures that others can audit the work and that the inference – how many jobs were “really” cut because of AI – is backed by open, reproducible analysis rather than opaque guesswork.
Conclusion and Recommendations
By combining text-based classification, seasonal-adjusted trends, and synthetic counterfactuals, we can separate AI-induced layoffs from those due to ordinary demand swings or staffing norms. For example, if in March 2026 we find layoffs far above the seasonal norm, heavily concentrated in firms that adopted AI and not mirrored by our synthetic control, that pattern would strongly suggest an AI effect. If not, we would attribute most of the layoffs to other factors (e.g. economic downturn or business restructuring) as opposed to AI.
This rigorous approach helps avoid false narratives. In a recent tech-cycle, critics warned of “AI-washing,” where companies blame AI for cuts that really stem from bad management (www.latimes.com) (www.hrdive.com). Our method gives evidence-based clarity.
Actionable Advice: To make the most of this methodology, stakeholders should work together on data and analysis. Companies should clearly state their layoff reasons – this transparency makes classification more reliable. Analysts and academics can build and publish open-source tools for text analysis and synthetic control, and they should always test alternate models. Policymakers can use these techniques to monitor labor-market changes in real time and design retraining programs targeted at jobs with high AI exposure. For workers, understanding these trends can guide which new skills to learn (e.g. shifting to roles where AI complements rather than replaces humans).
In sum, disentangling AI effects from seasonality or demand shocks requires careful, multi-pronged analysis. By following this transparent workflow – complete with cross-checks and sensitivity tests – we can draw more accurate conclusions about why jobs were lost in March 2026. This evidence-based approach supports sound decisions by businesses and government, rather than alarmist headlines or hindsight speculation.